
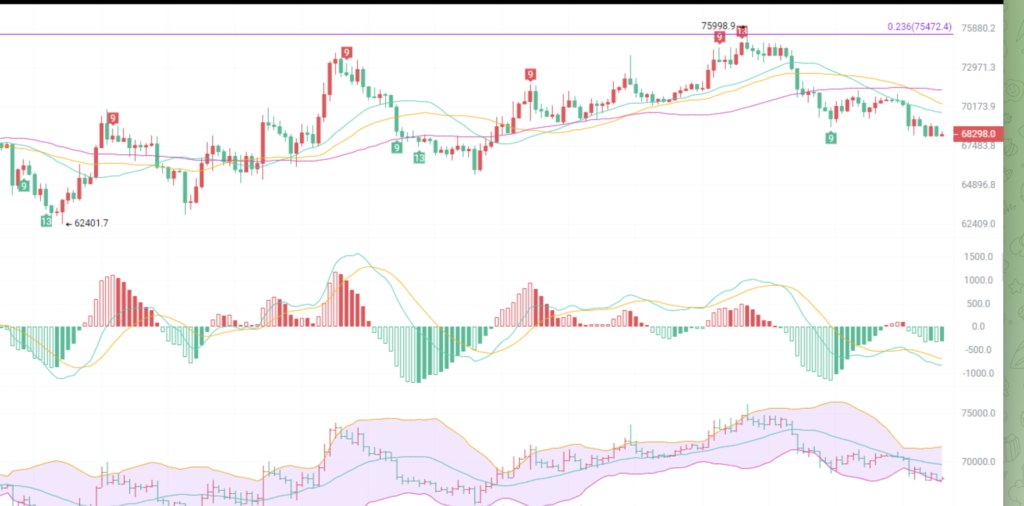
Bitcoin faces escalating downside risk if it breaks below $68k-$69k supports amid ongoing dump pressure. Analysts highlight layered demand zones from recent consolidations and moving averages as next potential floors.
## Immediate Supports
– **$68,500-$68,800**: Critical consolidation base and 30-day MA; high-volume defense seen March 3-23.[1][2][3]
– **$67,500-$67,800**: Liquidity zone and pivot low; failure accelerates momentum.[2][1]
– **$66,000-$67,000**: Range midpoint with prior bounces; aligns with neutral RSI tests.[4][5]
## Deeper Targets
– **$64,560-$65,000**: Structurally significant floor and accumulation zone; major reset level if breached.[6][4]
– **$61,530-$63,000**: Deepest near-term support; historical bottom before reversal potential.[7][6]
Bitcoin’s potential bounce from current supports would first test overhead supply zones hardened by recent rejections. Key resistances form from March highs, EMAs, and psychological barriers.
Immediate Resistances
• $70,000-$70,500: Primary psychological and multi-test cap; aligns with 20-day SMA and prior highs.
• $71,000-$71,800: Intraday pivot and 10 March high; heavy sell volume cluster.
Higher Barriers
• $72,000-$74,000: Major zone with March 4 peak ($74,071), 55-day SMA (~$72,500), and bear flag neckline.
• $75,000-$76,700: Extended target at 55-day SMA (~$75,628) and March 2025 lows; needs strong volume.
Major Ceiling
• $79,000-$80,000: February highs and round number; prior resistance turned supply wall.