
📅 Date: June 29, 2026 | 💰 BTC Price: ~$60,200 USD | 📊 Source: Aggregated (MetaMask, CoinGecko, Yahoo Finance — Binance API web_fetch returned empty; fallback used) | 😨 Fear & Greed: 18 — Extreme Fear
📉 Market Setup
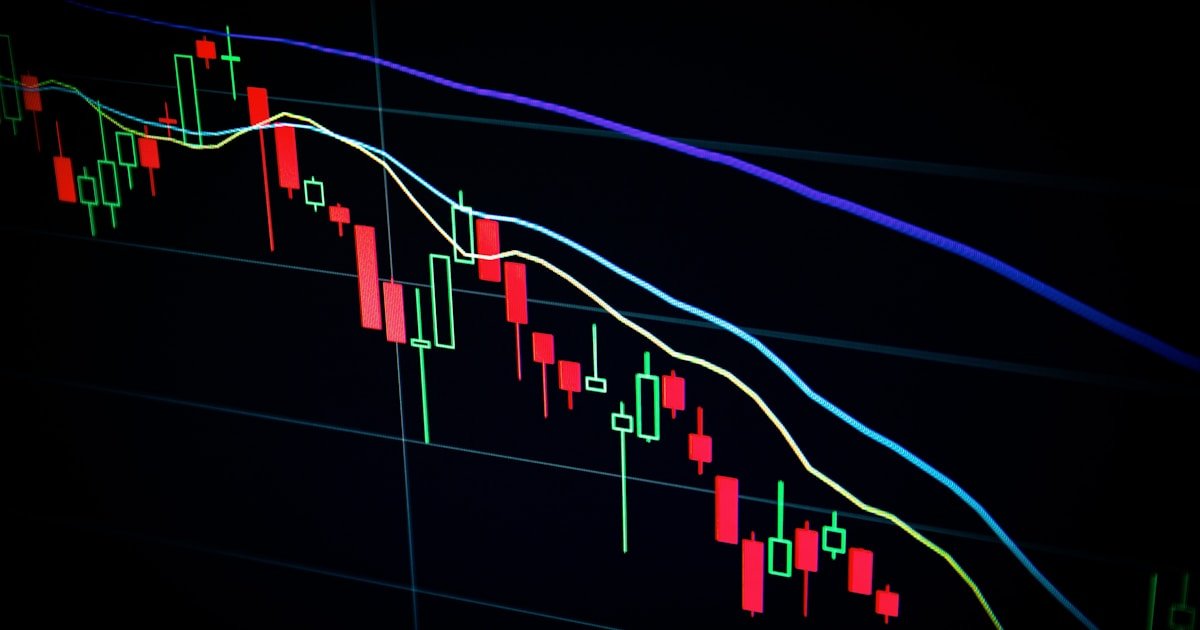
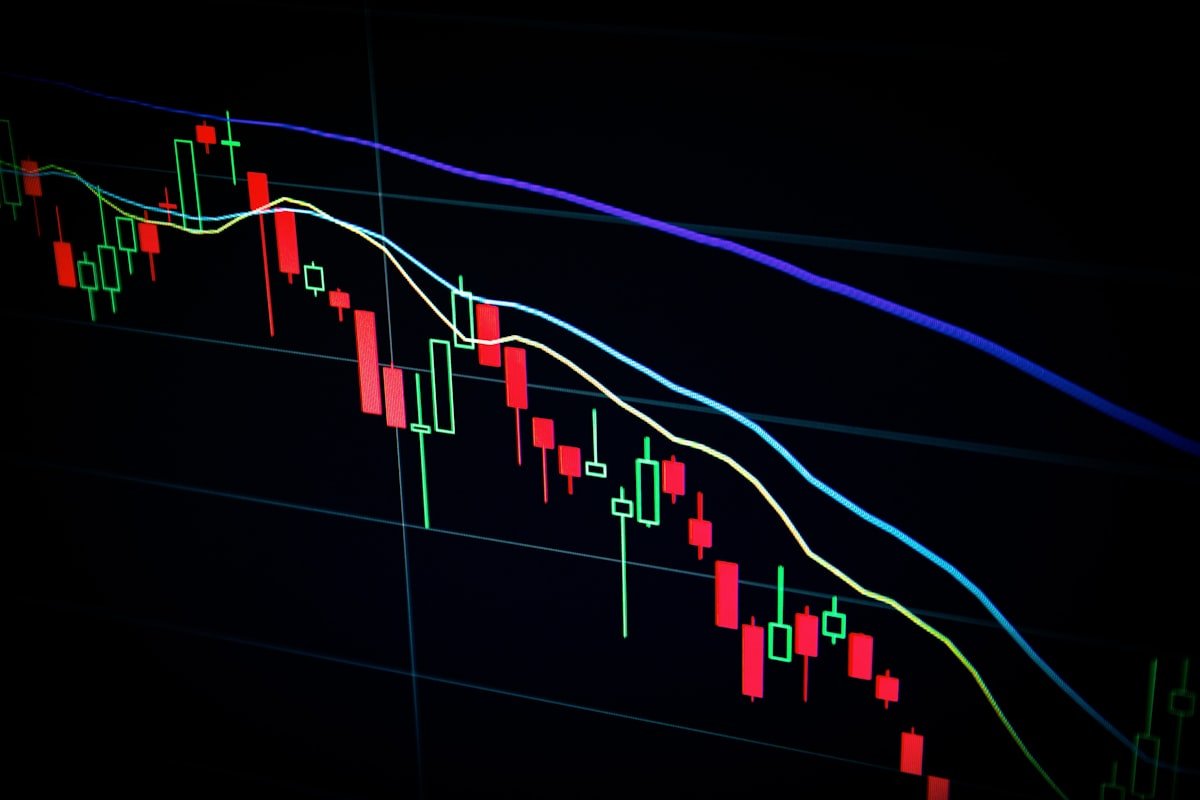
Bitcoin has been under significant pressure in June 2026, falling roughly 22% from its May 25 peak of $77,623 to current levels around $60,200. A confluence of institutional redemptions, hawkish Fed repricing, ETF outflows, and a global risk-off environment has driven the selloff. BTC is now testing a cluster of critical technical supports.
| Indicator | Value / Reading | Interpretation |
|---|---|---|
| Current Price | ~$60,200 | Near key support zone |
| 24h Change | Approx. flat / slight +$72 | Stabilizing after sharp drop |
| 7-Day Change | -4.47% to -6.80% | Continued short-term weakness |
| May 25 Peak | $77,623 | -$17,400 from top (~22%) |
| 200-Week MA | ~$62,457 | Critical macro support |
| 50-Month EMA | ~$65,631 | Major resistance above |
| Immediate Support | $59,241 | 1.6% below current price |
| Next Support | $58,115 | Key demand zone |
| Immediate Resistance | $62,457–$62,500 | 200-week MA + round number |
| Major Resistance | $64,178 – $65,631 | Range top / 50-month EMA |
| RSI (14) | ~31 | Near oversold — neutral/bounce zone |
| 4H 50 MA | Sloping up | Medium-term trend still up |
| Weekly 200 MA | Sloping up (since July 2024) | Long-term macro trend bullish |
| Short-Term Signals | 3 Bullish / 15 Bearish / 5 Neutral | Strong short-term bearish bias |
| Fear & Greed Index | 18 — Extreme Fear | Contrarian buy signal historically |
🎯 Trade Idea — June 29, 2026
With RSI approaching oversold territory (~31) and the Fear & Greed Index at Extreme Fear (18), conditions are historically conducive to a short-term bounce attempt. However, the dominant short-term trend remains bearish. Today’s idea is a high-risk contrarian bounce watch — only for experienced traders with strict risk management.
| Parameter | Level | Notes |
|---|---|---|
| Bias | ⚠️ Cautious Bullish (Bounce Watch) | Oversold + Extreme Fear setup |
| Entry Zone | $59,000 – $60,500 | Near immediate support; scale-in approach |
| Stop Loss | $57,400 | Below $58,115 key support; ~2.7% risk |
| Target 1 | $62,500 | 200-week MA / resistance; ~R:R 1:1.5 |
| Target 2 | $65,631 | 50-month EMA reclaim; ~R:R 1:3.5 |
| Target 3 | $70,000 | Psychological / prior support; ~R:R 1:5.4 |
| Risk/Reward | Up to 1:5.4 | Based on T3 vs. stop at $57,400 |
| Position Size | Reduced (25–50% of normal) | High-uncertainty environment |
| Invalidation | Close below $57,400 | Would signal deeper drop to $50K+ range |
⚡ Key Watch: A daily close back above the 200-week MA (~$62,457) would be the first confirmation that a meaningful bounce is underway. Without reclaiming that level, this remains a weak bounce in a downtrend.
🔑 Key Factors
🟢 Bullish Factors
- Extreme Fear (18): Historically, Fear & Greed readings below 20 have often preceded short-term bounces as panic sellers exhaust.
- RSI ~31 (Near Oversold): On the 4H and daily charts, RSI is approaching the oversold threshold — a common bounce trigger zone.
- 200-Week MA Support (~$62,457): This long-term macro support line has historically acted as a strong floor in previous Bitcoin bear cycles.
- Macro Uptrend Intact: Both the weekly 50 MA and 200 MA continue to slope upward — the long-term bull trend from mid-2024 has not been broken.
- Corporate Accumulation: Reports of ongoing corporate Bitcoin accumulation may provide a demand floor beneath current prices.
- Bitcoin ETF Narrative: Spot Bitcoin ETF infrastructure remains intact; any positive flow reversal could accelerate upside.
🔴 Bearish Risks
- Dominant Short-Term Bearish Signals: 15 of 23 technical indicators remain bearish — the path of least resistance is still down.
- Hawkish Fed Repricing: Markets are repricing rate-cut expectations lower, lifting the USD and pressuring risk assets including Bitcoin.
- ETF Outflows: Institutional redemptions from Bitcoin ETFs have contributed significantly to the June selloff — sustained outflows would pressure further.
- Below 50-Month EMA ($65,631): BTC is trading well beneath this major level — reclaiming it is necessary for a genuine bullish recovery.
- Leverage Flush Not Complete: Leveraged positions may still need to be flushed, potentially sending BTC toward $55,000–$58,000 before a true bottom forms.
- Macro Risk-Off Environment: Global risk aversion driven by geopolitical tensions and tightening financial conditions limits upside potential.
🌐 Macro Watch
Keep a close eye on the following macro factors that could significantly impact BTC price action this week:
- Fed Communications: Any hints of rate cuts or dovish pivots could sharply reverse Bitcoin’s decline. Watch FOMC minutes and Fed speaker comments.
- DXY (US Dollar Index): Dollar strength has been a primary headwind for BTC. A DXY reversal would be bullish for crypto.
- US Equities / Nasdaq: Bitcoin’s correlation with tech stocks remains elevated. Equity market direction will guide crypto sentiment.
- Bitcoin ETF Daily Flow Data: Monitor daily net flows from US spot Bitcoin ETFs — a return to net inflows would be the strongest bullish catalyst.
- PCE Inflation / CPI Data: Any upcoming inflation data prints will affect rate-cut expectations and risk appetite broadly.
📚 Sources
- CoinGecko — Bitcoin Live Price
- MetaMask — Bitcoin Price Today
- Yahoo Finance — Bitcoin Tumbles Below $60,000 (June 25, 2026)
- Fortune — Current Price of Bitcoin (June 26, 2026)
- Investing.com — Bitcoin Real-Time Technical Analysis
- Barchart — BTCUSD Trader’s Cheat Sheet
- CoinStats AI — Bitcoin Daily Market Analysis, June 24, 2026
- Note: Binance API (api.binance.com/api/v3/ticker/price) web_fetch returned an empty body. All prices sourced from aggregated web search results (fallback per task instructions).
⚠️ Risk Disclaimer
This post is for educational and informational purposes only and does not constitute financial, investment, or trading advice. Cryptocurrency markets are highly volatile and speculative. Past performance is not indicative of future results. Never invest more than you can afford to lose. Always conduct your own research (DYOR) and consult a qualified financial advisor before making any trading or investment decisions. The author and this website accept no liability for any losses incurred as a result of using this information.


Leave a Reply