
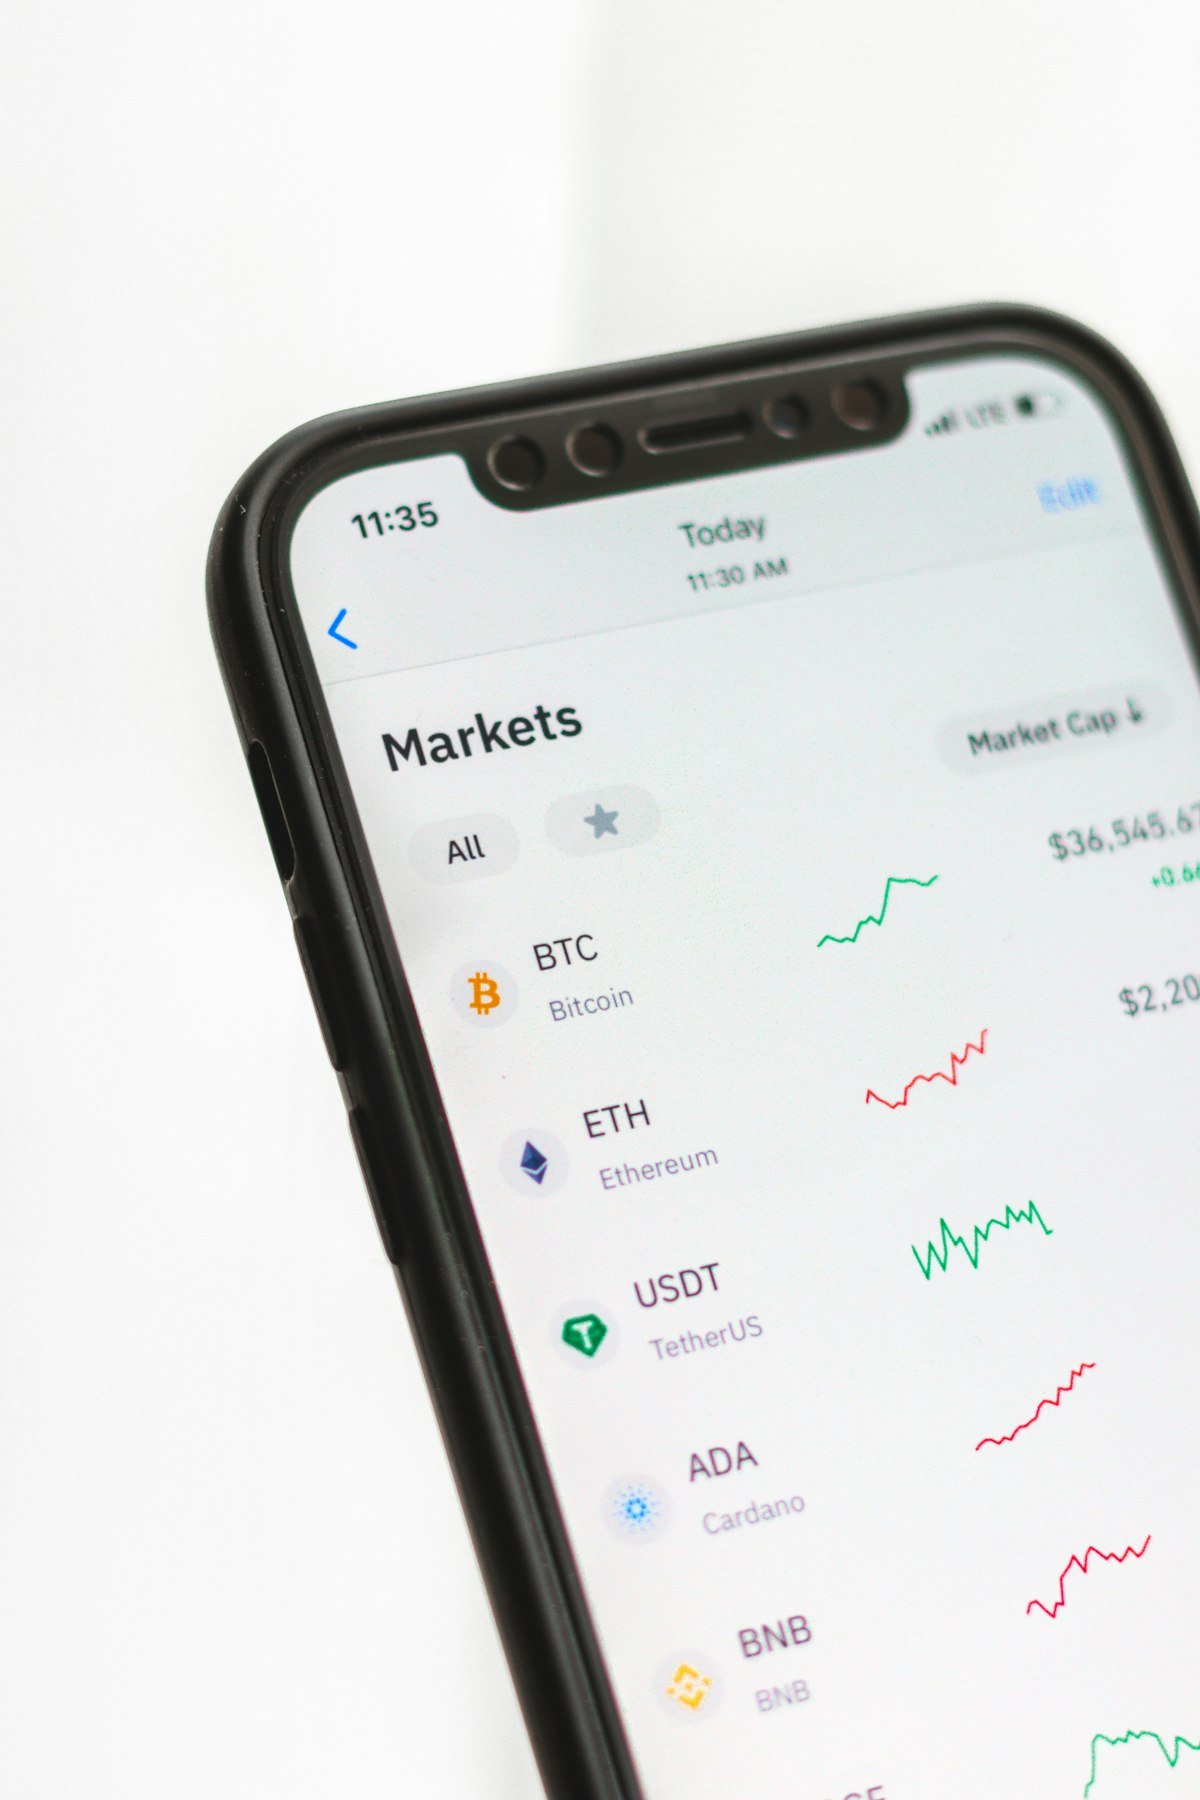
Bitcoin (BTC/USDT): $64,040 | 24h Change: +1.11% (+$705) | Date: August 18, 2026 | Source: Binance (api.binance.com), cross-checked against CoinGecko
Bitcoin is trading near $64,040 this morning, extending a relief bounce off support and reclaiming its 50-day moving average for the first time in several sessions. The move follows Wednesday’s Fed decision to hold rates, with Goldman Sachs now calling a September hike “very unlikely” after soft July jobs data cooled tightening expectations. BTC remains down sharply from its ~$93,000 level at the start of the year and is still trading roughly 49% below its October 2025 all-time high of $126,080 — so today’s strength looks like a controlled bounce inside a broader downtrend rather than a confirmed reversal.
Market Setup
- 24h Range: $63,295 – $64,610 (Binance); $63,246 – $64,516 (CoinGecko)
- 7-Day Range: $62,525 – $64,516
- Immediate Support: $63,600–$63,800 EMA/Fibonacci cluster (0.236 retracement ~$63,671)
- Deeper Support: $63,200 (structure invalidation) → $62,662–$62,783 range floor
- Immediate Resistance: $64,600–$65,000
- Critical Resistance Zone: $65,000–$70,000 (must reclaim to break the broader downtrend); range top at $66,000–$66,601 (recent monthly high)
- Moving Averages: 5-day MA ~$64,368 (price above, bullish short-term); 50-day MA ~$63,385 (price now back above, first time in several sessions)
- RSI: Daily (14-period) ~67.6 — approaching overbought but still in “buy” territory; 1-hour RSI ~73 — overbought, raises pullback risk; 7-day RSI ~50 — neutral
Trade Idea
| Parameter | Level |
|---|---|
| Bias | Cautiously Bullish (relief bounce within larger downtrend) |
| Entry Zone | $63,600 – $64,000 (pullback into EMA/Fib support) |
| Stop Loss | $63,150 (daily close below invalidates setup) |
| Target 1 | $64,600 (~1.2:1 R/R) |
| Target 2 | $65,500 (~2.6:1 R/R) |
| Target 3 | $66,600 (~4.3:1 R/R) |
Risk/Reward calculated from a mid-entry of $63,800 against a $63,150 stop (≈$650 risk).
Key Factors
Bullish
- Fed held rates on Wednesday; Goldman Sachs sees a September hike as “very unlikely”
- Soft July jobs report cooled expectations for further Fed tightening, supporting risk appetite
- BTC has reclaimed its 50-day moving average and daily RSI sits in bullish “buy” territory (~67.6)
- Broader risk-on flows tied to ongoing large AI-compute infrastructure deals are lifting sentiment across risk assets, including BTC
- Institutional treasury accumulation (e.g., Strategy/MSTR) continues to add structural demand
Bearish
- BTC remains ~49% below its October 2025 all-time high of $126,080 and down sharply from ~$93,000 at the start of 2026 — the primary trend is still down
- 1-hour RSI near 73 is overbought, raising the risk of a near-term pullback into the $63,200–$63,600 zone
- July CPI printed a sticky 3.4% y/y, keeping some inflation/rate-path uncertainty alive
- Price must reclaim the $65,000–$70,000 zone to meaningfully break the broader downtrend; failure to hold above $63,200 opens the path back to $62,662–$62,783
Macro Watch
Watch for any hawkish repricing of Fed policy expectations ahead of the September FOMC meeting, incoming CPI/jobs data, continued AI-compute-deal-driven flows into risk assets, and further corporate/institutional Bitcoin treasury purchases (Strategy and peers) as a source of structural demand.
Sources
- Binance BTCUSDT 24hr Ticker (live price source)
- CoinGecko — Bitcoin Price (cross-check)
- Investing.com — Bitcoin Real-Time Technical Analysis
- Bitcoin Foundation — US Fed Holds Rates, Bitcoin Stays Near $64K
- Phemex — Bitcoin Price Analysis August 2026
Disclaimer: This article is for informational and educational purposes only and does not constitute financial, investment, or trading advice. Cryptocurrency markets are highly volatile and speculative. Always do your own research and consult a licensed financial advisor before making any investment decisions. Trade at your own risk.












Leave a Reply